
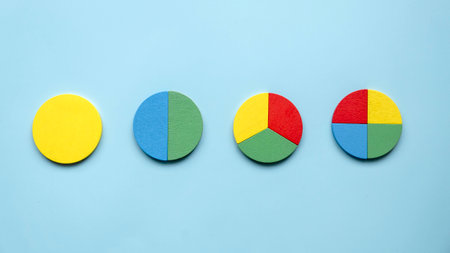
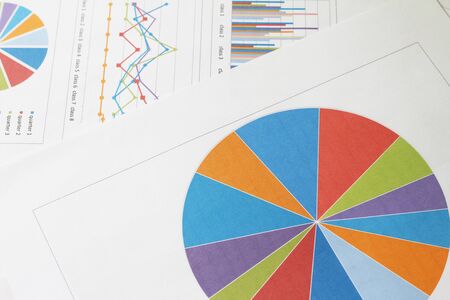
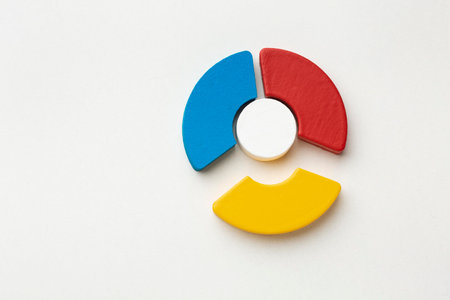
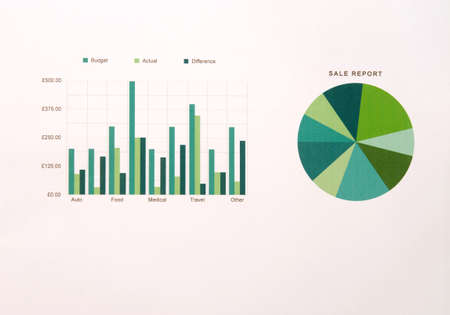
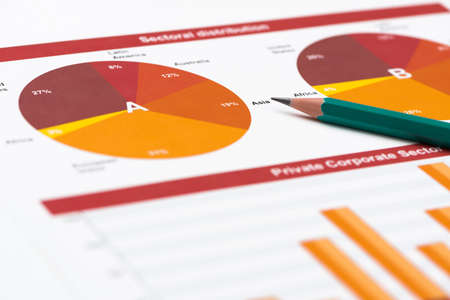
Pie charts representing diversified stock portfolios, diversification of investment or asset allocation on stock and fund and bond make investments more efficient
Коллекция по умолчанию
Коллекция по умолчанию
Создать новую

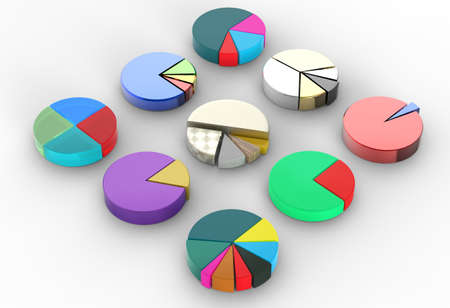
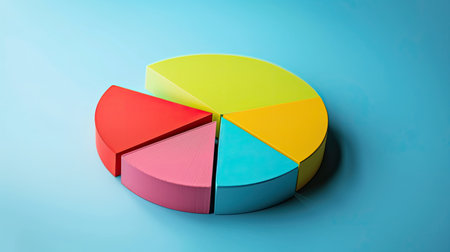
Stats concept with wood pie chart
Коллекция по умолчанию
Коллекция по умолчанию
Создать новую
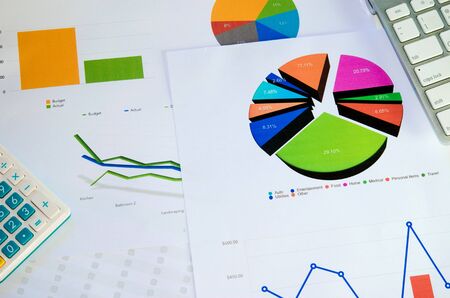
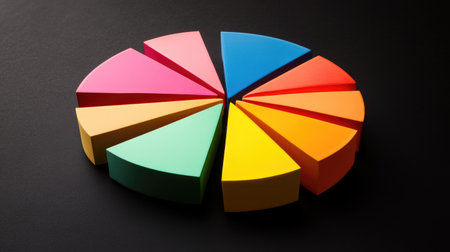
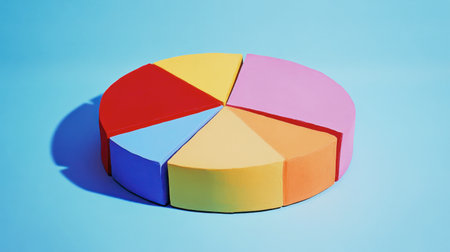
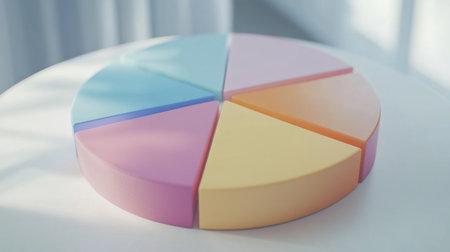
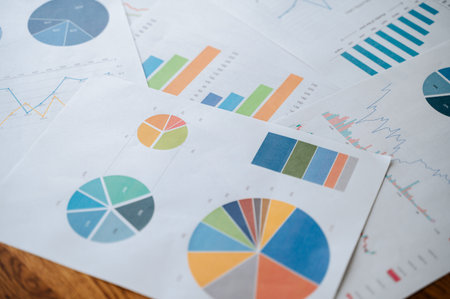
A colorful pie chart casts striking shadows on a surface, showcasing modern design and vibrant colors. Ideal for business or creative visualizations.
Коллекция по умолчанию
Коллекция по умолчанию
Создать новую

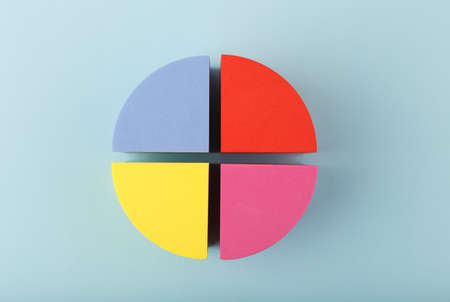
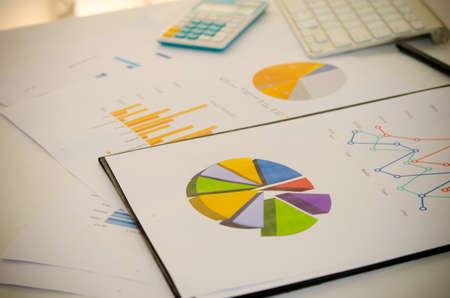
Colorful fraction circles arranged into a circle graph and hand, black background.
Коллекция по умолчанию
Коллекция по умолчанию
Создать новую

A creative pie chart with textured segments showing sales data, each slice representing a different product line, set against a rustic wooden table background.
Коллекция по умолчанию
Коллекция по умолчанию
Создать новую
A colorful financial pie chart showing market shares, with labeled sections representing stocks, bonds, and investments, displayed on a white background with clean lines.
Коллекция по умолчанию
Коллекция по умолчанию
Создать новую

Annual business report. Accountability paperwork. Hands holding a heap of documents with graphs and statistics
Коллекция по умолчанию
Коллекция по умолчанию
Создать новую

A colorful financial pie chart showing market shares, with labeled sections representing stocks, bonds, and investments, displayed on a white background with clean lines.
Коллекция по умолчанию
Коллекция по умолчанию
Создать новую

Graph of market share with black pen in business concept
Коллекция по умолчанию
Коллекция по умолчанию
Создать новую

3d pie chart showcasing business data percentages, set against a seamless gradient background
Коллекция по умолчанию
Коллекция по умолчанию
Создать новую

A vibrant pie chart displayed on a report demonstrates clear data analysis. Ideal for business presentations and financial insights in a professional setting.
Коллекция по умолчанию
Коллекция по умолчанию
Создать новую

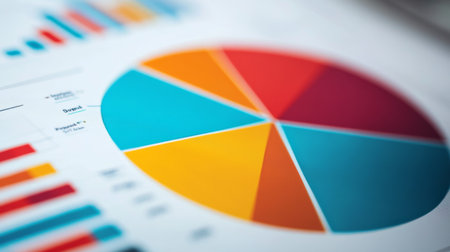
A close-up of a colorful business pie chart with segmented sections, showcasing data distribution and a clean, professional design.
Коллекция по умолчанию
Коллекция по умолчанию
Создать новую

An AI generated illustration of project management graphs charts paper
Коллекция по умолчанию
Коллекция по умолчанию
Создать новую

Business people during paperwork at meeting
Коллекция по умолчанию
Коллекция по умолчанию
Создать новую

Office workplace with laptop and pen and business document on wood table as concept
Коллекция по умолчанию
Коллекция по умолчанию
Создать новую
Pie charts on the table as a business or marketing analysis.
Коллекция по умолчанию
Коллекция по умолчанию
Создать новую

The work desk has a personal computer and various kinds of office stationery
Коллекция по умолчанию
Коллекция по умолчанию
Создать новую
This image features a colorful segmented circle design against a dark background, perfect for creative projects, educational materials, or graphic designs.
Коллекция по умолчанию
Коллекция по умолчанию
Создать новую

A macro shot of a pie chart in a presentation slide, capturing the distinct slices and their labels with a professional backdrop.
Коллекция по умолчанию
Коллекция по умолчанию
Создать новую
Finance and accounting business, business planing, accounting
Коллекция по умолчанию
Коллекция по умолчанию
Создать новую
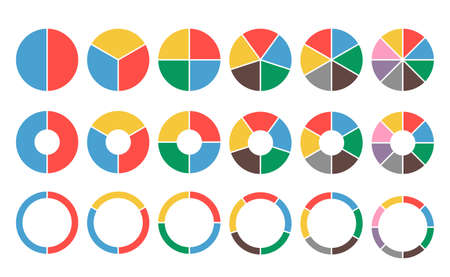
Large set of colored pie charts. 2,3,4,5,6,8 sections. Flat icons
Коллекция по умолчанию
Коллекция по умолчанию
Создать новую

A vibrant pie chart displayed on a wooden surface, showcasing various colors divided into sections. Perfect for visualizing data in reports or presentations.
Коллекция по умолчанию
Коллекция по умолчанию
Создать новую

A pie chart diagram on a whiteboard during a team meeting, with markers and eraser nearby.
Коллекция по умолчанию
Коллекция по умолчанию
Создать новую

pie chart divided into slices to represent different aspects of innovation within a business concept, such as product, process, and service innovation.
Коллекция по умолчанию
Коллекция по умолчанию
Создать новую

A visually appealing pie chart made of pastel colors against a soft blue background, perfect for educational materials, presentations, and creative projects.
Коллекция по умолчанию
Коллекция по умолчанию
Создать новую

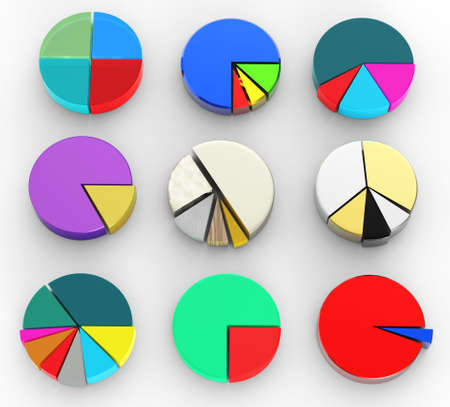
A vibrant collection of 3D pie chart segments resting on a glossy surface, showcasing a modern approach to data visualization and analysis in business contexts.
Коллекция по умолчанию
Коллекция по умолчанию
Создать новую

Charts and graphs display data insights on a table, while vibrant holiday ornaments add a festive touch to the workspace, creating a cheerful atmosphere.
Коллекция по умолчанию
Коллекция по умолчанию
Создать новую
set of different pie chart on isolated background
Коллекция по умолчанию
Коллекция по умолчанию
Создать новую

A vibrant pie chart displayed on a table, surrounded by office supplies and documents, illustrating business analysis and data visualization concepts.
Коллекция по умолчанию
Коллекция по умолчанию
Создать новую
Colorful different shape of wooden pie chart pieces.
Коллекция по умолчанию
Коллекция по умолчанию
Создать новую

Colorful pie chart on wooden table, representing data visualization and analysis..
Коллекция по умолчанию
Коллекция по умолчанию
Создать новую

A vibrant pie chart model featuring colorful segments on a glass table. Ideal for educational, business, and creative presentations to illustrate concepts effectively.
Коллекция по умолчанию
Коллекция по умолчанию
Создать новую

A high-angle view of a 3D pie chart with labeled segments, placed on a desk alongside business documents and a laptop, symbolizing data analysis in a corporate setting.
Коллекция по умолчанию
Коллекция по умолчанию
Создать новую

A high-resolution image of a rotating 3D pie chart, highlighting financial performance metrics with clear, labeled sections and a neutral backdrop.
Коллекция по умолчанию
Коллекция по умолчанию
Создать новую
Colorful cycle diagram. Business concept. Red, yellow, pink and blue cycle diagram on bright blue background with copy space.
Коллекция по умолчанию
Коллекция по умолчанию
Создать новую

Colorful pie chart with vibrant segments displayed on a table, ideal for showcasing data analysis and business presentations in a creative and engaging manner.
Коллекция по умолчанию
Коллекция по умолчанию
Создать новую

Woman holding business reports
Коллекция по умолчанию
Коллекция по умолчанию
Создать новую

A vibrant pie chart and graphs displayed on a wooden office desk, emphasizing data analysis and business insights in a professional workspace.
Коллекция по умолчанию
Коллекция по умолчанию
Создать новую

A high-angle view of a 3D pie chart with labeled segments, placed on a desk alongside business documents and a laptop, symbolizing data analysis in a corporate setting.
Коллекция по умолчанию
Коллекция по умолчанию
Создать новую

A close-up of a pie chart illustrating market share distribution, with percentages highlighted for each segment.
Коллекция по умолчанию
Коллекция по умолчанию
Создать новую

A colorful circular wooden plate with segmented colors rests on a dark wood surface, showcasing vibrant artistic craftsmanship and modern design elements.
Коллекция по умолчанию
Коллекция по умолчанию
Создать новую

Pie charts representing diversified stock portfolios, diversification of investment or asset allocation on stock and fund and bond make investments more efficient
Коллекция по умолчанию
Коллекция по умолчанию
Создать новую

businessman hand working on wooden desk in office and there are many documents, graphs. Can be attributed to financial articles.
Коллекция по умолчанию
Коллекция по умолчанию
Создать новую

Male hand showing diagram or chart on financial report with pen. Growth and success
Коллекция по умолчанию
Коллекция по умолчанию
Создать новую

A high-angle view of a 3D pie chart with labeled segments, placed on a desk alongside business documents and a laptop, symbolizing data analysis in a corporate setting.
Коллекция по умолчанию
Коллекция по умолчанию
Создать новую

Financial paper charts and graphs on the table.Business Concept
Коллекция по умолчанию
Коллекция по умолчанию
Создать новую

A vibrant pie chart on a light surface, perfect for business presentations, data analysis, or creative projects, showcasing colorful segments for visual impact.
Коллекция по умолчанию
Коллекция по умолчанию
Создать новую

A vibrant pie chart sits atop a background filled with various financial graphs and charts. The pie chart features segments of blue, yellow, pink, orange, and gray. The image showcases a bright color palette, soft lighting, and an illustrative style, suitable for business and commercial applications.
Коллекция по умолчанию
Коллекция по умолчанию
Создать новую
set of different pie chart on isolated background
Коллекция по умолчанию
Коллекция по умолчанию
Создать новую

Business workplace with keyboard mouse and papers with graphs and diagrams
Коллекция по умолчанию
Коллекция по умолчанию
Создать новую

A colorful pie chart placed on a wooden desk, surrounded by various office supplies, notes, and a laptop. Ideal for business and productivity themes.
Коллекция по умолчанию
Коллекция по умолчанию
Создать новую

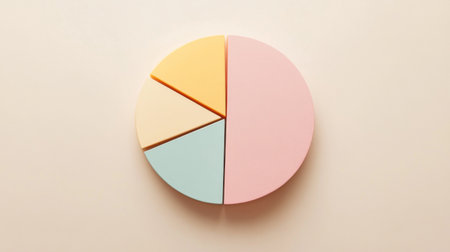
A colorful paper pie chart showcases pastel hues on a minimalist background, creating an engaging visual representation of data and creativity.
Коллекция по умолчанию
Коллекция по умолчанию
Создать новую
Vibrant paper segments arranged on a dark surface showcase creativity and modern design, ideal for business and educational presentations or artistic projects.
Коллекция по умолчанию
Коллекция по умолчанию
Создать новую

A detailed shot of a D pie chart with segmented sections and labels, displaying data in a visually engaging and three-dimensional format.
Коллекция по умолчанию
Коллекция по умолчанию
Создать новую

Close-up view of a 3D pie chart with segments highlighted in different shades, showing detailed labels and percentages for clear data representation.
Коллекция по умолчанию
Коллекция по умолчанию
Создать новую
This vibrant paper pie chart features six segments in various colors, set against a blue background, ideal for business presentations or educational materials.
Коллекция по умолчанию
Коллекция по умолчанию
Создать новую

A creative pie chart with textured segments showing sales data, each slice representing a different product line, set against a rustic wooden table background.
Коллекция по умолчанию
Коллекция по умолчанию
Создать новую

A detailed shot of a printed pie chart on a desk, with vibrant segments representing different data categories and a calculator beside it.
Коллекция по умолчанию
Коллекция по умолчанию
Создать новую

A close-up of a financial pie chart on a printed report, with distinct color segments representing different financial categories, placed on a clean white desk.
Коллекция по умолчанию
Коллекция по умолчанию
Создать новую

Business plan documents and charts for eco-tourism startup on rustic wooden table
Коллекция по умолчанию
Коллекция по умолчанию
Создать новую
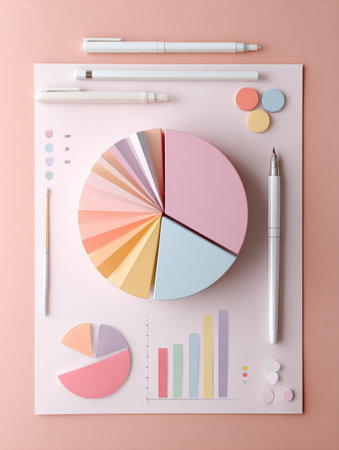
A pastel minimalist pie chart showcases budget planning essentials laid out on a soft background with complementary stationery and chart elements.
Коллекция по умолчанию
Коллекция по умолчанию
Создать новую
Vibrant and colorful charts and graphs illustrating data analysis, showcasing insights for business and marketing strategies in a professional context.
Коллекция по умолчанию
Коллекция по умолчанию
Создать новую
graph chart of stock market investment trading.
Коллекция по умолчанию
Коллекция по умолчанию
Создать новую
Top view statistics presentation Set
Коллекция по умолчанию
Коллекция по умолчанию
Создать новую
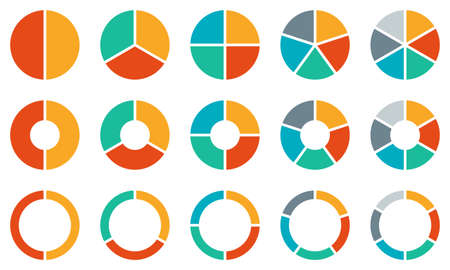
Pie chart set. Colorful diagram collection with 2,3,4,5,6 sections or steps. Circle icons for infographic, UI, web design, business presentation. Vector illustration.
Коллекция по умолчанию
Коллекция по умолчанию
Создать новую

Small team working together with business reports
Коллекция по умолчанию
Коллекция по умолчанию
Создать новую
A minimalistic pie chart with pastel-colored slices representing different budget categories, displayed on a light background with percentages clearly labeled for easy understanding.
Коллекция по умолчанию
Коллекция по умолчанию
Создать новую

Close-up of colorful pie chart segments resting on a wooden surface. This image illustrates data representation and visual analysis concepts for various applications.
Коллекция по умолчанию
Коллекция по умолчанию
Создать новую
A vibrant pie chart model featuring pastel shades, elegantly placed on a white table, perfect for illustrating data visualization concepts in educational or business contexts.
Коллекция по умолчанию
Коллекция по умолчанию
Создать новую

colorful bar graph pie chart desk pink background
Коллекция по умолчанию
Коллекция по умолчанию
Создать новую

Businessman analyzing investment charts with laptop. Accounting and finance concept.
Коллекция по умолчанию
Коллекция по умолчанию
Создать новую

A dynamic business meeting scene showcasing teamwork and data analysis. The focus is on documents and charts that illustrate important insights and strategies.
Коллекция по умолчанию
Коллекция по умолчанию
Создать новую

Vibrant pie chart visualization representing data analysis. Ideal for business presentations, reports, and infographics to enhance understanding of statistics and trends.
Коллекция по умолчанию
Коллекция по умолчанию
Создать новую

Image of several hands over business charts
Коллекция по умолчанию
Коллекция по умолчанию
Создать новую
Business paperwork present with diagram.
Коллекция по умолчанию
Коллекция по умолчанию
Создать новую
A pie chart with vibrant colors and business growth indicators
Коллекция по умолчанию
Коллекция по умолчанию
Создать новую
Top view documents with analytics data on table
Коллекция по умолчанию
Коллекция по умолчанию
Создать новую

A clean and professional pie chart printed on paper, showing market share data with colorful sections, placed on a desk alongside other business documents.
Коллекция по умолчанию
Коллекция по умолчанию
Создать новую

A visual display of a pie chart alongside a line graph, showing diversified portfolio allocations and risk analysis for a financial investment strategy meeting.
Коллекция по умолчанию
Коллекция по умолчанию
Создать новую

A colorful pie chart sits on a wooden desk next to a laptop and documents, representing data analysis and business strategy in a modern workspace.
Коллекция по умолчанию
Коллекция по умолчанию
Создать новую

Detailed graphs and charts displayed on paper capture vital business metrics and analysis, showcasing data-driven insights for strategic planning and informed decision-making.
Коллекция по умолчанию
Коллекция по умолчанию
Создать новую

Business statistics, financial analysis, growth and development concept: colorful 3D pie isometric charts set
Коллекция по умолчанию
Коллекция по умолчанию
Создать новую

A minimalistic pie chart with pastel-colored slices representing different budget categories, displayed on a light background with percentages clearly labeled for easy understanding.
Коллекция по умолчанию
Коллекция по умолчанию
Создать новую

Vibrant pie chart segments showcasing various colors on a sleek surface. Ideal for business, education, and data visualization themes. Perfect for modern designs.
Коллекция по умолчанию
Коллекция по умолчанию
Создать новую

A visually striking image of a D pie chart with segments popping out and a sleek, professional design, perfect for reports, presentations, or data analysis.
Коллекция по умолчанию
Коллекция по умолчанию
Создать новую

A close-up of a D pie chart with metallic textures, displaying financial performance analysis, with key figures and data points highlighted.
Коллекция по умолчанию
Коллекция по умолчанию
Создать новую

A vibrant pie chart sits on a light blue table surrounded by office supplies, stationery items, and notes, perfect for business planning and creative projects.
Коллекция по умолчанию
Коллекция по умолчанию
Создать новую

Colorful pie chart on a complex data background
Коллекция по умолчанию
Коллекция по умолчанию
Создать новую

Close up of financial charts and graphs on wooden desk in office.
Коллекция по умолчанию
Коллекция по умолчанию
Создать новую

reports and histograms on paper on the table in the hands of a girl, analytics and statistics on paper, business analytics
Коллекция по умолчанию
Коллекция по умолчанию
Создать новую
business documents with charts growth
Коллекция по умолчанию
Коллекция по умолчанию
Создать новую
This colorful pie chart illustration features segments in various hues on a soft blue background, perfect for use in business, marketing, or creative presentations.
Коллекция по умолчанию
Коллекция по умолчанию
Создать новую
Charts and graphs of sales as symbol of successful corporate business
Коллекция по умолчанию
Коллекция по умолчанию
Создать новую

This vibrant pie chart on a blue background visually represents data segments with bright colors. Ideal for business, education, and marketing presentations.
Коллекция по умолчанию
Коллекция по умолчанию
Создать новую

A pie chart breakdown of sector allocations in an investment portfolio, highlighting diversification strategies.
Коллекция по умолчанию
Коллекция по умолчанию
Создать новую

man holding graph with computer on working table
Коллекция по умолчанию
Коллекция по умолчанию
Создать новую

A colorful pie chart sits atop a detailed business report, highlighting data analysis and performance insights. An ideal image for financial presentations.
Коллекция по умолчанию
Коллекция по умолчанию
Создать новую

A vibrant pie chart composed of four sections in blue, red, yellow, and orange, set against a soft yellow background, ideal for marketing and educational materials.
Коллекция по умолчанию
Коллекция по умолчанию
Создать новую
A pie chart illustrating the breakdown of consumer spending habits in different demographic groups
Коллекция по умолчанию
Коллекция по умолчанию
Создать новую

Close-up of a laptop screen displaying a colorful pie chart with financial data.
Коллекция по умолчанию
Коллекция по умолчанию
Создать новую
Legion-Media
Создайте свои проекты на основе качественных стоковых фотографий и видео.


Copyright © Legion-Media.